
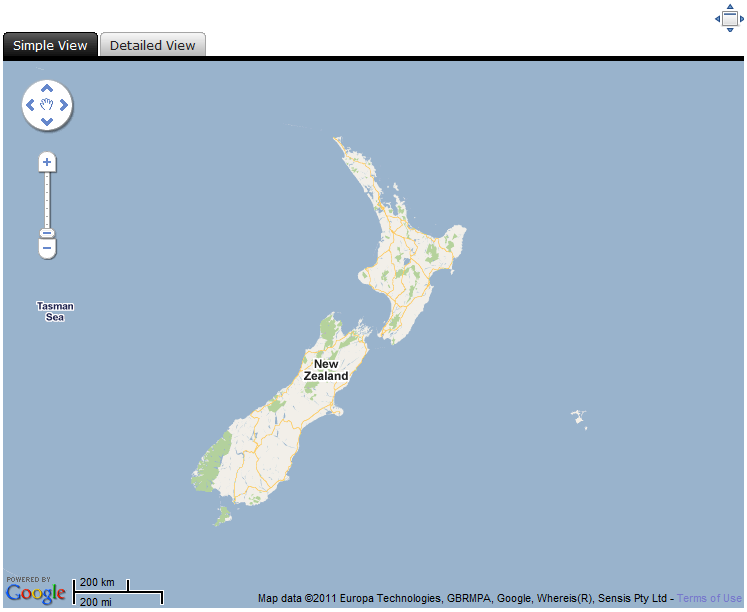
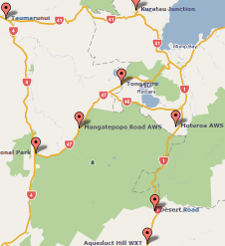
Map
The Map screen displays observation and forecast information in overlay and widget format on a Google Map. The default map display is shown below:
View Mode
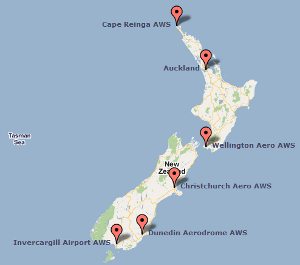
The view mode controls the amount of geographical labeling present on the map. The map will load in a simple view by default. The view can be switched to a detailed mode to show place name information.
Examples of a simple and detailed view of New Zealand are shown below:
 |
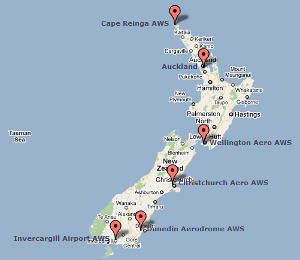 |
| Simple View | Detailed View |
Overlay Information
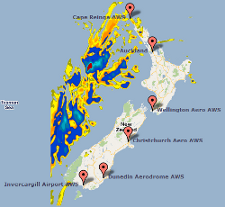
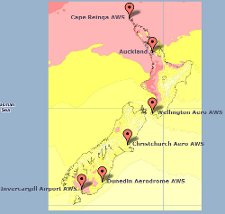
Overlay Information is available for both observation and forecast data. Once selected, the overlay is presented on the Map. Some example overlays are provided below:
 |
 |
 |
|
Rain Radar Overlay |
Rain Model Forecast |
Temperature Model Forecast |
Slider Playback
Where an overlay returns a series of images across a time period, a slider will appear at the bottom of the map:

The slider controls behave as follows:
 |
Play the overlay images. |
 |
Play the overlay images in a loop. |
 |
Alter the speed at which the overlay images are played. |
 |
Change the image resolution. |
 |
Change the static overlay image to a different time of day. |
 |
Indicates the time for the currently displayed overlay image. When the images are playing the yellow marker will move appropriately. The yellow marker can also be manually dragged up and down the slider to alter the visible overlay image. |
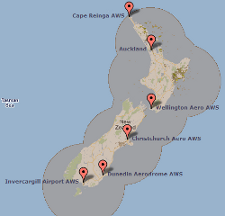
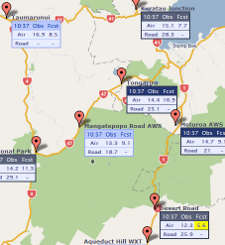
Weather Stations
Weather stations provide observation information for a specific location. The weather station widgets available display these observations and forecast information from weather models. There are currently three weather station settings for the Map, as shown below:
 |
 |
 |
|
None |
Temperature |
Overnight Minimum |
Different weather stations will be visible at different zoom levels, to prevent clutter in the display onscreen. The NZ Map display includes only main centres or weather stations that are considered important to the organisation of the logged in user. As the Map is zoomed to a particular region or location more weather stations appear.
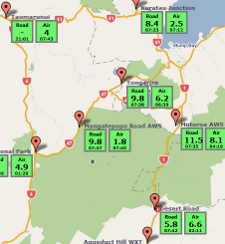
Weather Observation Widget
Displays observation data at a given location. These widgets appear as follows:
![]()
Hover over the widget for information about the location of the weather station and the time at which the last observation data was received.
The information contained in the widget is explained below:
 |
A black compass is placed over the location at which observations are collected. This compass includes wind information including:
|
 |
The air temperature value in degrees Celsius |
 |
The intensity of the rain over the last 10 minutes
|
 |
The accummulated rainfall for the last hour in mm |