
Trend
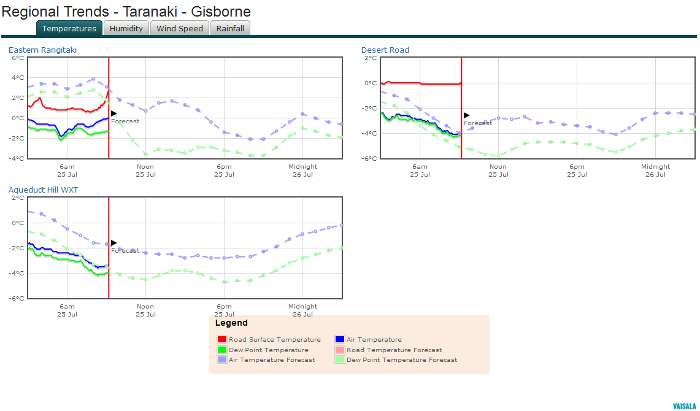
The Regional Trends page displays current observation and forecast information in a graph format for an organisation configured subset of weather stations within a geographical region. This is a collection of meteograms, that display the last six hours of observed data from a MetService weather station and the following 16 hours forecast for the same site.
We have grouped a number of these meteograms together so you can compare current, past and future weather conditions of different sites in the same general area.
You can select which region to view meteograms from by selecting from the REGION pull down menu at the top of the left-hand menu.
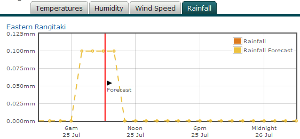
The observed and forecast conditions are separated by a red vertical line. Observations are on the left of this line and forecasts are on the right.
We have provided meteograms for each of:
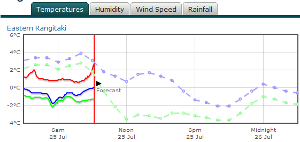
• Temperatures (air temperature and dew point
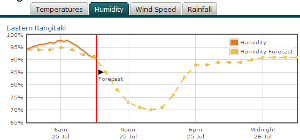
• Humidity
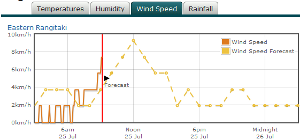
• Wind speed
• Rainfall
The dashed line extending the full length of the meteogram is the forecast value, while the solid line is the observed value. The observed only extends to ‘now’ while we carry the forecast back in time so you can see how well the forecast has been performing against observations for the same time.
You can mouse-over the observed and forecast lines on the meteogram to ascertain the actual observation or forecast values for that time.
An example for the Waikato Region is shown below:
For each weather station there are four different graphs available:
 |
 |
|
Temperatures
|
Humidity
|
 |
 |
|
Wind Speed |
Rainfall |
The region being displayed can be altered via the Region Controller:
Detailed information for an individual weather station can be accessed by clicking on the name of the weather station, which is a link to Current Trends.