Trend
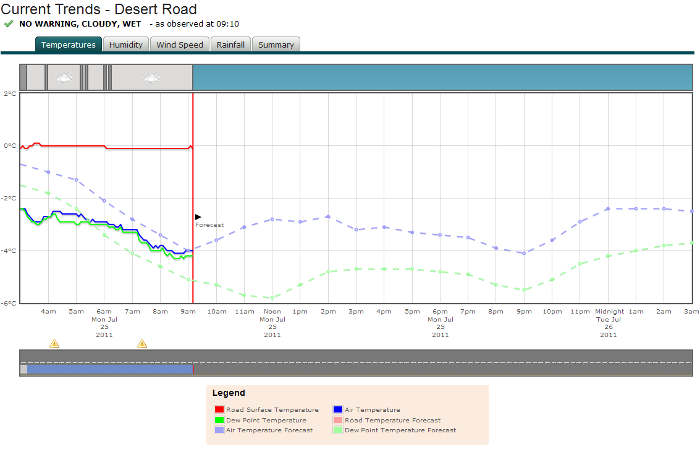
The Current Trends page displays detailed observation and forecast information for a specific weather station. The trend provides the last six hours of observations and the following 16 hours of forecasts in a meteogram.
The observed and forecast conditions are separated by a red vertical line. Observations are on the left of this line and forecasts are on the right.
We have provided meteograms for each of:
• Temperatures (air temperature and dew point
• Humidity
• Wind speed
• Rainfall
• If the station is a road weather station, some additional parameters are provided on the meteogram, such as state of the sky and road.
• A Summary tab provides a tabular view of the observations over the past hour, in fiveminute increments.
The dashed line extending the full length of the meteogram is the forecast value, while the solid line is the observed value. The observed only extends to ‘now’ while we carry the forecast back in time so you can see how well the forecast has been performing against observations for the same time.
You can mouse-over the observed and forecast lines on the meteogram to ascertain the actual observation or forecast values for that time.
An example Current Trends page for Kopu East is shown below:
Location Controller
The location displayed within the region can be altered via the Location Controller: