
Hour
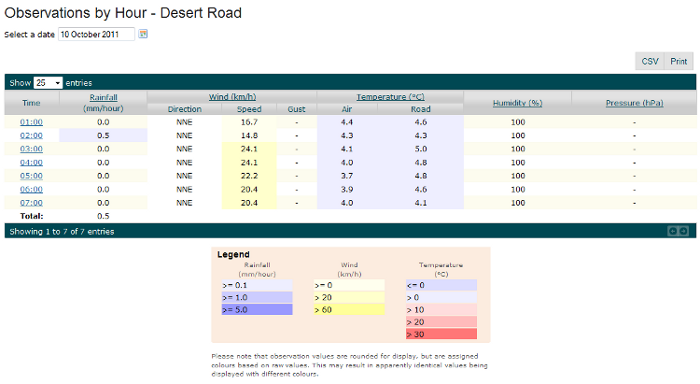
Observations by Hour lists observations collected for the 24 hour period from 10am to 10am at hourly or half-hourly intervals. The observation data may include rainfall, wind direction, wind speed, wind gust, air temperature, road temperature, humidity and pressure; dependent on the observation equipment that is present at the particular weather station location. Observation information is colour coded based on its value, a legend is provided to indicate the threshold values. A graph of each type of observation can be displayed by clicking the column heading.
• Table displaying hourly weather observations for the location of interest. o By default, hourly observations from the current day are shown.
• You can select from 10, 25, 50 or 100 entries. (25, 50 and 100 entries default to 24).
• To access hourly data from another date, other than the default ‘today’, use the Select a date window to select a day of interest. A date pad will appear, and you can either select from this or navigate to another month using the <<, >> arrows at the top of the date pad.
• To navigate from this hourly data to minute data, click on the underlined hyperlinked time value in the left-hand column. This is a useful feature if you find an anomaly in the hourly data, for instance a heavy rainfall event and you’d like to understand when, during the hour, this rain commenced.
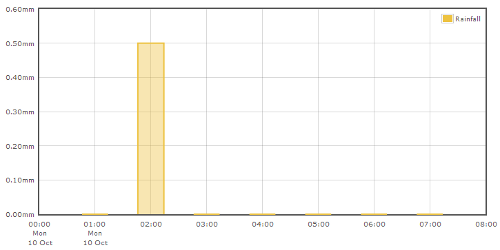
• Graphs of the data are plotted if you click on the hyper-link at the top of each data column.
• The values in this table are colour-coded, based on the key below the table.
• The data can be printed by clicking on the Print button on the top right of the table.
An example Observations by Hour screen is shown below:
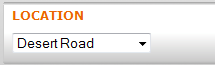
Location Controller
The location displayed within the region can be altered via the Location Controller:
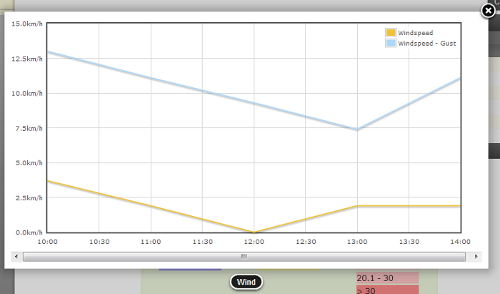
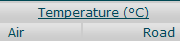
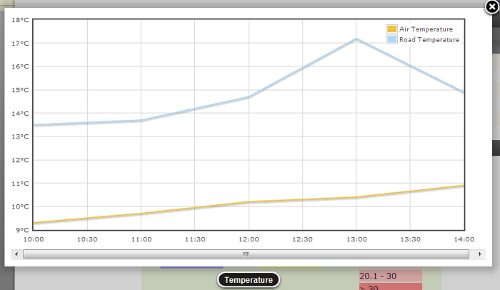
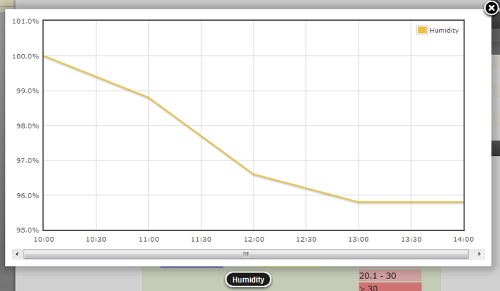
Observation Graphs
Each type of observation has an associated graph that can be accessed via the table header, as below:
 |
 |
 |
 |
 |
 |
 |
 |
Export Information
There are options provided to export the information displayed in the Observations by Hour table in a CSV or print format using the following buttons:
