Aggregated 3 Day Forecast
MetService has access to a number of weather prediction models and our meteorologists regularly select the best-performing one for any given weather event. The model that has been selected is displayed in these modelled forecast fields as Model of the Day.
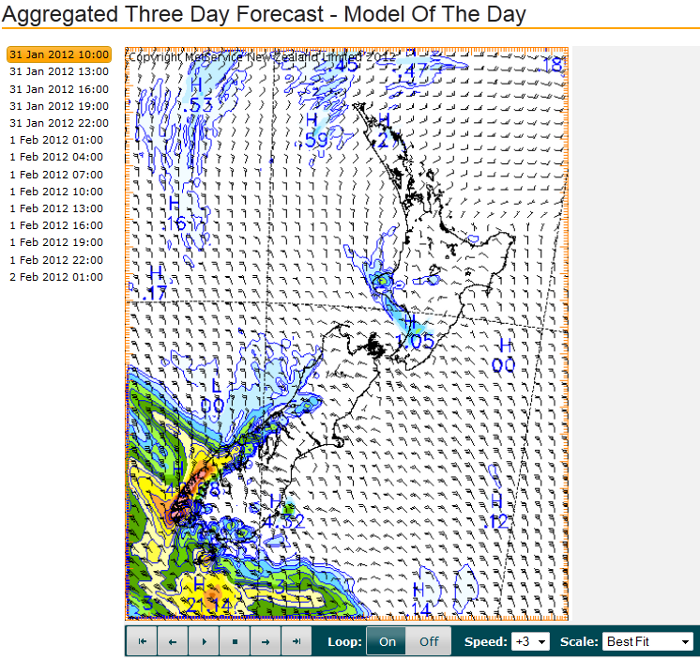
This module provides a national overview of forecast rainfall, wind and snow, combined into one graphic.
The animation controller, loop toggle, speed controller and legend button can be used as described below.
The Aggregated 3 Day Forecast model shows wind, rain and snow forecast. Images are available at three hourly intervals for up to 72 hours in the future.
• Rain is displayed as a coloured overlay defined by the legend. Local three-hour accumulation maxima are also displayed. In the example to the right, the three-hour accumulation is expected to be 33.64mm which you can see written in blue text over the yellow area.
• Wind is displayed in knots as wind barbs where a half barb is 5 knots, a full barb is ten knots and a pendant is 50 knots. One knot is 1.85km/hr. The direction the wind is blowing from is denoted by the orientation of the wind shaft.
• Snow. A thick purple line is drawn around the area that is cold enough to generate snow. If that line has precipitation within it, then that precipitation could be expected to fall as snow.

Navigation
|
The navigation bar at the left of the Aggregated 3 Day Forecast shows the series of times at which forecast images are available. The forecast time for the current image is highlighted in orange. As the player buttons are used, the highlighted image time will alter accordingly. To alter the displayed image, hover the mouse on a time that is visible in the list. To quickly navigate through all the images available, hover across the orange bar available at the far left. |
 |
Player
Images can be animated using the player buttons, which operate as follows:
 |
Display the first image in the series |
 |
Display the previous image in the series |
 |
Play the images in sequence |
 |
Stop the images playing in sequence |
 |
Display the next image in the series |
 |
Display the last image in the series |
| When playing the images, treat the data series as a loop to jump from last to first and vice versa. | |
| Alter the speed at which images are played. Selecting a negative speed will play images in reverse order. |
