
Minute
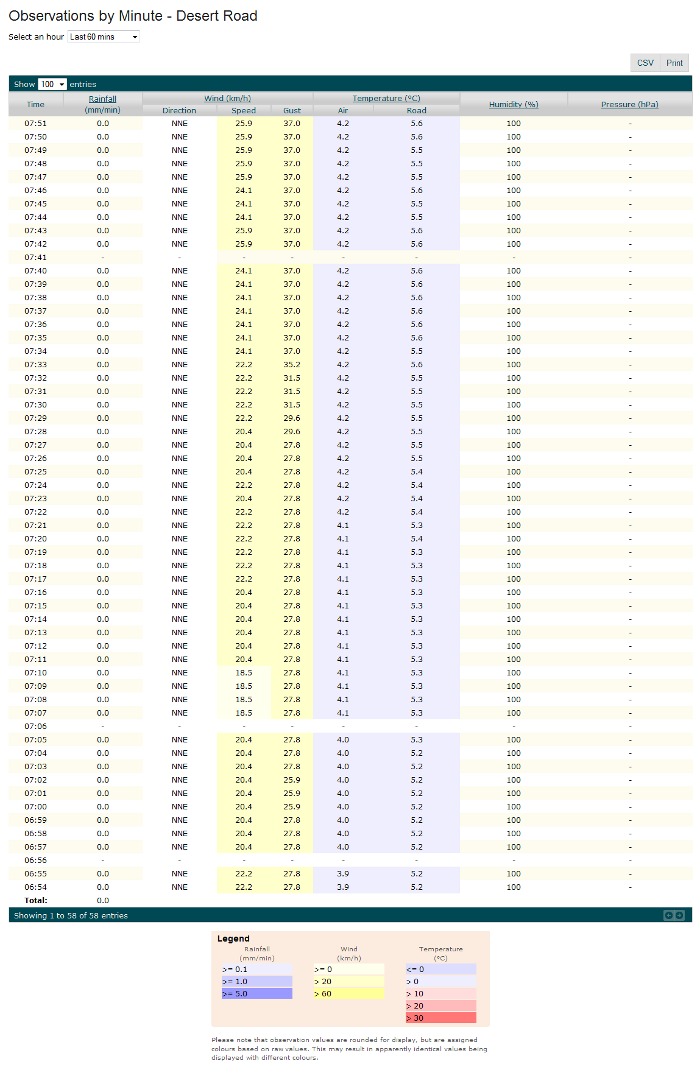
Observations by Minute lists observations collected for one minute intervals. The observation data may include rainfall, wind direction, wind speed, wind gust, air temperature, road temperature, humidity and pressure; dependent on the observation equipment that is present at the particular weather station location. Observation information is colour coded based on its value, a legend is provided to indicate the threshold values. A graph of each type of observation can be displayed by clicking the column heading.
• By default, 60 observations from the current hour are shown, however if you wish to view the last 60 minutes from any hour from the previous 24 hours, use the Select an hour pull down menu from the top of the table.
• You can change the number of entries in the table by selecting an entry from the Show x entries pull down menu at the top left of the table.
• Graphs of the data are plotted if you click on the hyper-link at the top of each data column.
• The values in this table are colour-coded, based on the key below the table, so you can quickly note unusual or abnormal conditions.
• The data can be printed by clicking on the Print button on the top right of the table.
An example Observations by Minute screen is shown below:
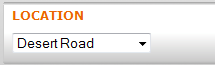
Location Controller
The location displayed within the region can be altered via the Location Controller:
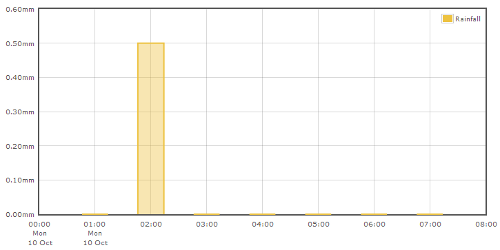
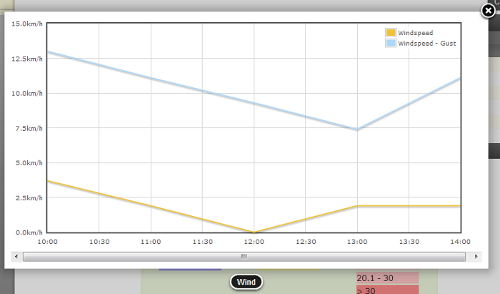
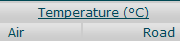
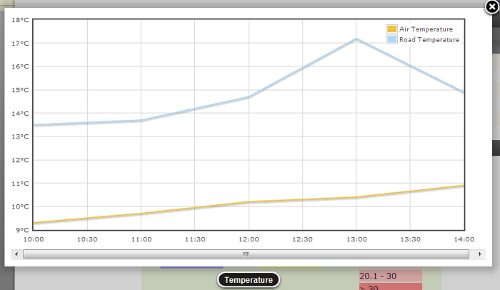
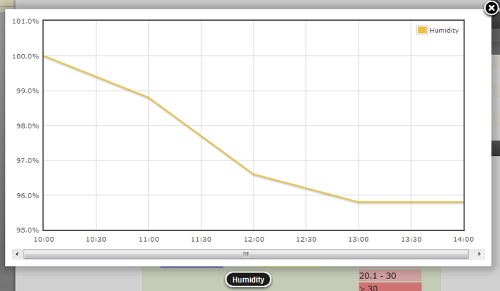
Observation Graphs
Each type of observation has an associated graph that can be accessed via the table header, as below:
 |
 |
 |
 |
 |
 |
 |
 |
Export Information
There are options provided to export the information displayed in the Observations by Minute table in a CSV or print format using the following buttons:
